How to Choose the Best SIP Fund in 2026: A No-Nonsense Guide

There are over 2,500 mutual fund schemes registered with SEBI in India right now. If you search "best SIP fund 2026" today, you will find dozens of lists — each one recommending different funds, based almost entirely on the past year's returns. This is one of the most dangerous ways to pick a fund, and it costs Indian investors crores in foregone wealth every year.
This guide gives you a framework that actually works. Five filters, applied in sequence, will cut through the noise and help you identify funds with genuine, repeatable performance — not just lucky streaks. Whether you are starting your very first SIP or reviewing a portfolio you have been running for years, this process applies.
Before you begin, use CalcPhi's free SIP Calculator to model how much your planned monthly investment could grow over your chosen horizon. Seeing the destination before you start makes the selection process far more purposeful.
Why Chasing Last Year's Top Funds Is a Trap
Every January, investment apps flood users with "Top 10 funds of the year" notifications. These lists rank funds by their 12-month return — and investors pile in. The problem is that one-year performance is almost entirely driven by sector concentration, not manager skill.
A fund that returned 52% in 2024 was probably heavily positioned in defence, railways, or PSU stocks — sectors that went on a government-spending-fuelled run. That same fund, in 2025 when those sectors cooled, may have handed back much of those gains. The investor who chased the headline number bought in at the peak and sold in frustration near the trough.
The correct approach is to find funds with consistent, risk-adjusted returns across full market cycles — both the bull runs and the corrections. That consistency is what the five filters below are designed to identify.
Filter 1 — Match the Fund Category to Your Goal and Time Horizon
Before you look at a single return figure, answer two questions: what is this money for, and when will you need it?
The answers determine which fund category is appropriate. A 28-year-old building a retirement corpus for the next 30 years has an entirely different risk capacity than a 45-year-old saving for a child's college fees due in four years. The fund market offers categories for every scenario.
For long-term wealth creation over 10 years or more, large-cap and flexi-cap equity funds form the right core. Large-cap funds invest at least 80% in India's top 100 companies by market capitalisation — they are more stable during downturns and have lower drawdown risk. Flexi-cap funds give the manager freedom to move between large, mid, and small-cap stocks as valuations shift, making them a versatile core holding.
For investors with a 7-year-plus horizon who can stomach more volatility in exchange for higher potential returns, mid-cap funds are the natural growth engine. Mid-cap stocks — companies ranked 101 to 250 by market cap — have historically delivered higher returns than large-caps over long periods, but corrections of 40–50% are common and real. Small-cap funds carry even higher upside and risk, and are best held as a satellite allocation of no more than 20–25% of your overall SIP portfolio.
For tax-saving under Section 80C, ELSS (Equity Linked Savings Scheme) funds are the best option. They have a mandatory three-year lock-in — the shortest of any 80C instrument — and returns are taxed as Long-Term Capital Gains at 12.5% above ₹1.25 lakh per year.
For medium-term goals of three to five years, balanced advantage funds and aggressive hybrid funds offer a smoother ride by dynamically allocating between equity and debt.
| Goal / Horizon | Recommended Category | Expected Return (Long Run) |
|---|---|---|
| Wealth building, 10+ years | Large-cap or Flexi-cap | 11–14% CAGR |
| Aggressive growth, 7+ years | Mid-cap or Small-cap | 13–18% CAGR (higher volatility) |
| Tax saving (80C), 3+ years lock-in | ELSS | 12–15% CAGR |
| Medium-term goal, 3–5 years | Balanced Advantage / Hybrid | 9–12% CAGR |
| Emergency corpus or <2 years | Liquid or Ultra-short duration | 6–7.5% CAGR |
Picking the right category first is the most important decision you will make. The best small-cap fund in the wrong hands — held by an investor who panics at a 40% drawdown and redeems — will still destroy wealth.
Filter 2 — Expense Ratio: The One Cost That Compounds Against You
Every mutual fund charges an annual fee called the Total Expense Ratio, or TER. This percentage is deducted from the fund's assets daily before the NAV is calculated, which means you never see it as a separate charge — but it silently erodes your returns every single day.
A direct plan of the same fund charges a significantly lower TER than a regular plan, because regular plans include the distributor's commission — typically 0.8% to 1.3% per year. Over 20 years on a ₹10,000 monthly SIP at 12% gross returns, the difference between a 0.5% TER (direct) and a 1.8% TER (regular) amounts to roughly ₹15–16 lakh in your pocket.
| TER | Net Return | Maturity Value | Cost of High Fees |
|---|---|---|---|
| 0.5% (Direct plan) | 11.5% | ₹92.9 lakh | — |
| 1.0% | 11.0% | ₹86.4 lakh | ₹6.5 lakh |
| 1.8% (Regular plan via distributor) | 10.2% | ₹77.1 lakh | ₹15.8 lakh |
Always invest in direct plans. You can buy them directly on the AMC's website, through the MF Central platform (maintained by AMFI and RTAs), or through direct-plan apps like Groww, Zerodha Coin, or ETMONEY. As a general benchmark, a TER above 1% for large-cap equity funds should raise questions. Flexi-cap and mid-cap direct plans commonly range between 0.4% and 0.8%.
Filter 3 — Rolling Returns, Not Point-to-Point Performance
Point-to-point returns — "this fund gave 18% over 5 years" — are highly dependent on the start and end dates chosen. A fund that crashed in March 2020 and was measured from that low to a 2025 peak will show spectacular returns that have nothing to do with manager skill.
Rolling returns solve this. A 5-year rolling return measures the fund's performance over every possible 5-year window within the last 10 years — every day as a start date, every corresponding end date. This gives you hundreds of data points instead of one. What you want to see is that the fund beat its benchmark in at least 65–70% of those rolling windows.
A fund that beats the Nifty 100 or Nifty 500 index consistently across rolling periods — including the periods that covered the 2020 crash, the 2022 rate-rise selloff, and the 2024–25 mid and small-cap correction — is demonstrating genuine, repeatable outperformance. A fund that shows a strong 5-year point-to-point return but mediocre rolling consistency is riding a lucky streak.
You can find rolling return data for free on Value Research Online, PrimeInvestor, and Morningstar India. Spending 15 minutes on rolling returns will save you from making a decision you will regret three years later.
Want to see how consistent compounding plays out in real numbers? Try CalcPhi's Step-Up SIP Calculator to model how even modest annual increases to your SIP amount dramatically change your final corpus — assuming the fund delivers consistent returns rather than volatile swings.
Filter 4 — Fund Size: The Capacity Problem Nobody Talks About
Fund size — the AUM (Assets Under Management) — matters more for some categories than others, and in a counterintuitive way.
A ₹500-crore small-cap fund can take meaningful positions in genuinely under-discovered companies with growth potential. A ₹25,000-crore small-cap fund cannot. At that size, buying even a 2% position in a ₹2,000-crore company would mean owning 25% of that company — which SEBI regulations and liquidity concerns make impossible. So the large fund is forced to either dilute into larger companies (defeating the purpose of small-cap investing) or hold cash (which drags returns).
- Large-cap funds: AUM size matters much less — the underlying large-cap market is deep and highly liquid. ₹5,000–₹80,000 crore is fine.
- Mid-cap funds: Be cautious above ₹25,000 crore. Fund managers often drift into large-cap territory to deploy cash at this scale.
- Small-cap funds: Treat ₹15,000–20,000 crore as a red flag. The best small-cap fund managers know this — which is why funds like Nippon India Small Cap and SBI Small Cap have periodically restricted fresh SIP inflows when they felt their size was limiting their ability to invest well. A fund closing for fresh investments is a sign of integrity, not weakness.
Filter 5 — Fund Manager Tenure and Track Record
Fund houses have brand names. Fund performance follows people. When a star fund manager leaves, performance often dips for two to three years as the incoming manager rebuilds the portfolio according to their philosophy. If you invested based on the past track record and didn't notice the manager change, you are now holding a very different fund than the one that built that record.
Before finalising a fund, check the current manager's tenure on that specific scheme. If it is under two years, the historical returns do not reflect their decisions — and you are making a bet on someone with an unproven track record at that fund.
Also check how many schemes a manager runs simultaneously. Managing more than four to five schemes is a red flag for attention-splitting. India has produced world-class fund managers — the good ones tend to run focused portfolios with deep conviction positions, not sprawling multi-scheme responsibilities.
Putting It All Together: A Simple Starter Portfolio
For most Indian salaried investors with a 15-plus year horizon, three funds cover the market adequately without over-complicating the portfolio.
| Fund Category | Allocation | Monthly SIP | Role |
|---|---|---|---|
| Flexi-cap or Large-cap | 50% | ₹10,000 | Stable core |
| Mid-cap | 30% | ₹6,000 | Growth engine |
| Small-cap | 20% | ₹4,000 | High-growth satellite |
Resist the temptation to add a fourth or fifth fund "for diversification." At three funds across large, mid, and small cap, you already own a significant slice of the Indian equity market. Adding more funds just means holding the same stocks through multiple schemes — adding complexity at tax time without adding real diversification.
Once you have selected your funds, use CalcPhi's ELSS Calculator if any of your chosen funds are ELSS, to model both the tax savings under Section 80C and the projected corpus after the three-year lock-in.
Also consider reading CalcPhi's guide on SIP vs Fixed Deposit if you are deciding between equity SIPs and guaranteed-return instruments, and the Step-Up SIP guide if you want to understand why increasing your SIP by 10% annually is one of the most powerful wealth-building moves available to a salaried investor.
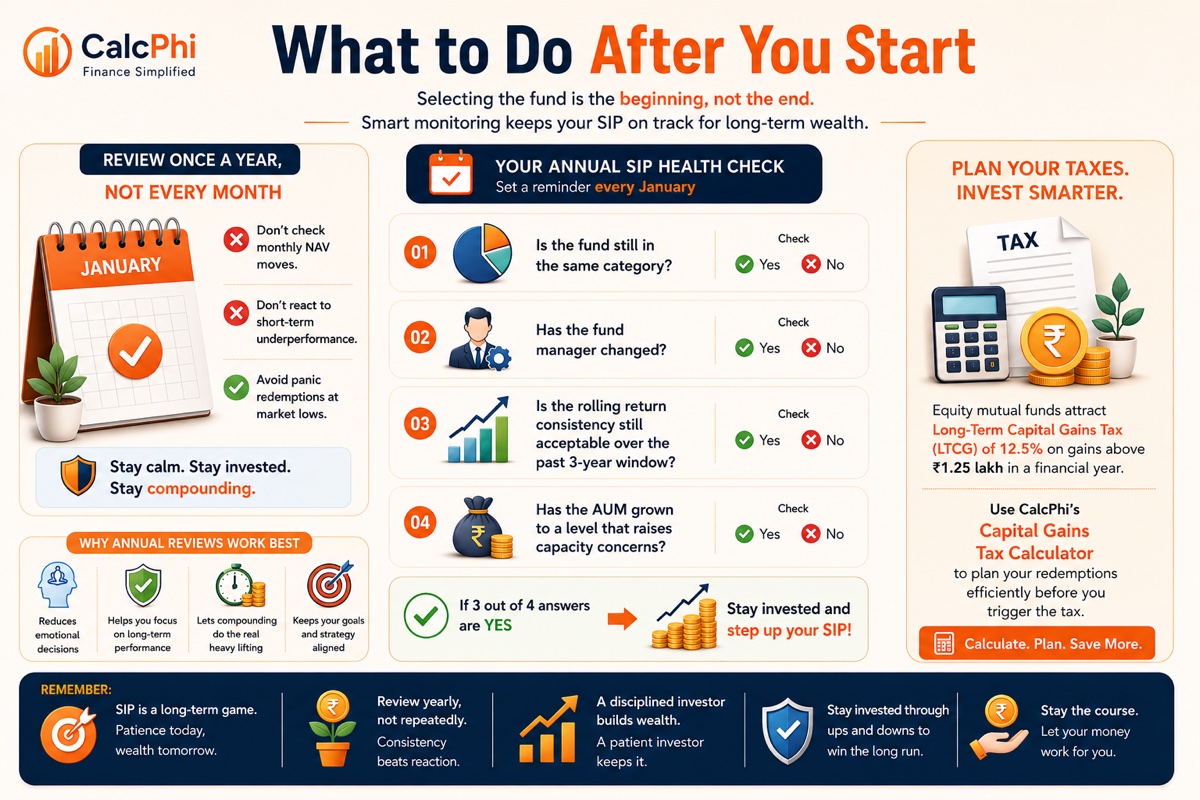
What to Do After You Start
Selecting the fund is the beginning, not the end. Review your SIP portfolio once a year — not more often. Checking monthly NAV movements and reacting to short-term underperformance is the fastest way to destroy long-term returns through panic redemptions at market lows.
Set a calendar reminder for every January to run a simple check: Is the fund still in the same category? Has the fund manager changed? Is the rolling return consistency still acceptable over the past 3-year window? Has the AUM grown to a level that raises capacity concerns? If three of these four answers are fine, stay invested and step up your SIP.
If you need to calculate how your growing portfolio affects your tax liability — particularly Long-Term Capital Gains on equity funds above ₹1.25 lakh per year — use CalcPhi's Capital Gains Tax Calculator to plan your redemptions efficiently before you trigger the tax.
Frequently Asked Questions
-
How many SIP funds should I have in my portfolio?
Two to three funds is the ideal number for most investors. With a well-chosen large-cap or flexi-cap fund, a mid-cap fund, and a small-cap fund, you cover the full Indian equity market spectrum without unnecessary duplication. Going beyond four funds typically creates overlap — the same underlying stocks appear across multiple schemes — while adding complexity at tax time with no meaningful diversification benefit.
-
Should I switch my SIP fund if it underperforms for one year?
No. One year of underperformance relative to peers or the benchmark is meaningless noise. Even excellent fund managers go through 12-to-18-month periods of underperformance during sector rotations that do not favour their investment style. Give a fund a minimum of three full years before making a judgment call — and always compare it against its category benchmark, not against the market broadly or against a fund in a different category.
-
Is it safe to start a SIP when the market is at an all-time high?
Yes, because SIPs are specifically designed to remove the need to time the market. Every month, your fixed investment buys more units when the NAV is low and fewer units when it is high — this is rupee cost averaging. Historical SEBI and AMFI data consistently shows that SIPs started at any Nifty level, including all-time highs, produce positive real returns over a 10-year-plus horizon. The risk of waiting for a correction is almost always greater than the risk of starting at a peak.
-
What is the difference between a direct plan and a regular plan?
A direct plan is one you buy directly from the AMC or through a direct-plan platform, with no distributor in the chain. A regular plan includes a commission for the distributor — typically 0.8% to 1.3% per year — built into the fund's expense ratio. Over 20 years on a sizeable SIP, this commission difference can amount to ₹15–20 lakh in lost wealth. SEBI mandates that all funds offer both options; always choose direct unless you are receiving ongoing, documented financial advice that justifies the cost.
-
What happens to my SIP if the AMC shuts down?
Your money is safe. SEBI regulations require that mutual fund assets be held by an independent custodian — completely separate from the AMC's own balance sheet. If an AMC shuts down, the fund's assets are either transferred to another AMC or wound up and the proportionate NAV is returned to investors. This has happened in India before (Franklin Templeton's debt fund winding in 2020) and investors received their money back, with interest, over 18–24 months.
-
How do I calculate how much my SIP will be worth in 15 years?
Use CalcPhi's free SIP Calculator — enter your monthly SIP amount, expected annual return (12% is a commonly used long-run estimate for equity funds, though not guaranteed), and tenure in years. The calculator shows you the total amount invested, the returns earned, and the final corpus. You can also model the impact of annual step-ups using the Step-Up SIP Calculator.
Model your SIP returns and tax impact:
SIP Calculator → Step-Up SIP Calculator → ELSS Tax Calculator → Capital Gains Calculator →Disclaimer:The information in this article is for educational and estimation purposes only. Mutual fund investments are subject to market risks. Past performance is not a guarantee of future returns. All figures used are illustrative examples and do not constitute financial advice. Consult a SEBI-registered investment advisor before making investment decisions based on your individual financial situation, risk tolerance, and goals.