SIP Returns: What a 12% Annual Return Actually Means Month to Month

Every mutual fund advertisement carries a disclaimer: "past returns are not indicative of future performance." But almost every financial plan assumes exactly 12% annual returns from SIP investments. That number gets thrown around so casually that most investors develop a completely wrong mental model of how their money actually grows month to month. The reality is messier, more interesting, and ultimately more reassuring than the clean 12% figure suggests.
What Is CAGR, and Why Does It Hide the Real Story?
CAGR stands for Compound Annual Growth Rate. It is a single number that describes the average annual growth rate of an investment over a period, assuming the returns compound every year. If your SIP of ₹10,000 per month grows to ₹23 lakh over 10 years, the CAGR works out to roughly 12%.
The problem is that CAGR is a backward-looking, smoothed number. It tells you where you ended up on average — it tells you nothing about the journey. And in equity mutual funds, the journey is anything but smooth.
A 12% CAGR does not mean your portfolio earns 1% every month. It does not mean every year ends in the green. What it actually means is that over the entire holding period, the compounding effect of wildly varying monthly and annual returns averages out to approximately 12% per year. Some months will deliver 6% gains. Some months will deliver 10% losses. The average over a decade lands near 12%.
The Monthly Reality: What Your SIP Statement Actually Shows
Assume you invest ₹10,000 per month in a diversified large-cap equity fund with a long-term CAGR of 12%.
What investors expect: Their corpus grows by roughly 1% per month in a steady line, reaching around ₹1,27,000 at the end of Year 1.
What actually happens: The market goes through corrections, rallies, sideways phases, and occasional sharp drops. In a typical year, monthly returns can range from −8% in a bad month to +7% in a good one. There is no straight line.
The key insight: the monthly return equivalent of 12% annual CAGR is actually 0.949% per month — not 1%. This is because compounding multiplies returns, it doesn't simply add them. The formula is: Monthly Rate = (1 + Annual Rate)^(1/12) − 1. At 12% annual, that works out to approximately 0.949% monthly. Even in a perfectly smooth market, you are not earning a neat 1% every 30 days.
A Year-by-Year Look at What 12% CAGR Really Looks Like
The table below shows a hypothetical 10-year SIP journey based on Nifty 50-like return patterns. The individual annual returns are modelled on historical volatility. The long-term average comes to approximately 12% CAGR — but look at what happens in between.
| Year | Annual Return | Corpus at Year End |
|---|---|---|
| Year 1 | +28% | ₹1,35,000 |
| Year 2 | −15% | ₹1,79,000 |
| Year 3 | +18% | ₹3,74,000 |
| Year 4 | +22% | ₹5,86,000 |
| Year 5 | −30% | ₹5,32,000 |
| Year 6 | +42% | ₹10,05,000 |
| Year 7 | +15% | ₹13,44,000 |
| Year 8 | +8% | ₹16,58,000 |
| Year 9 | +5% | ₹19,08,000 |
| Year 10 | +18% | ₹23,71,000 |
Total invested over 10 years: ₹12,00,000. Final corpus: approximately ₹23.71 lakh. CAGR: approximately 12.1%.
Notice Year 5. Despite you continuing to invest ₹10,000 every single month, your corpus actually drops from ₹5.86 lakh to ₹5.32 lakh. That is a real, visible, anxiety-inducing dip in your net worth — even though you did nothing wrong. This is what a −30% year does to an equity portfolio. And it happens more often than people expect.
The Year 5 Trap: Why Most Investors Quit at the Worst Possible Time
Year 5 in the table above is a turning point — not because it is the worst year, but because it comes after a period of decent growth. By this point, an investor has been running their SIP for nearly five years. They check their statement, see a corpus lower than it was a year ago, and start to doubt everything.
Research on retail investor behaviour in India consistently shows that SIP cancellations spike during market corrections, particularly in the 2–5 year window. And the tragedy is that Year 6 in our example delivers a 42% return — the single biggest wealth-creation year in the entire 10-year journey. The investors who exited in Year 5 miss it entirely.
This is why financial advisors emphasise time in the market over timing the market. Rupee cost averaging — the mechanism that makes SIPs powerful — works precisely because you keep buying units even when prices fall. A market correction is not a reason to stop your SIP. It is when your SIP becomes most effective, accumulating more units at lower prices.
How SIP Returns Differ from Lumpsum Returns at 12% CAGR
If you invest ₹1 lakh as a lumpsum and it earns 12% CAGR over 10 years, you end up with approximately ₹3.11 lakh. The calculation is straightforward: ₹1,00,000 × (1.12)^10.
With a SIP, every instalment you invest has a different effective tenure. The ₹10,000 you invest in Month 1 has 10 years to grow. The ₹10,000 you invest in Month 119 has only 1 month. So your effective CAGR experience varies instalment by instalment. This is why SIP returns are properly measured using XIRR, not CAGR. If you see "12% CAGR" on a fund brochure, that is a lumpsum calculation. Your SIP XIRR will look different — and that is not a problem, it is just math.
What If the Market Delivers Only 8% Instead of 12%?
At 8% CAGR, a ₹10,000/month SIP for 10 years grows to approximately ₹18.4 lakh. At 12% CAGR, it grows to ₹23.2 lakh. At 15% CAGR, it reaches ₹27.9 lakh. The difference between 8% and 12% outcomes is significant — about ₹4.8 lakh on a ₹12 lakh investment. But notice that even at 8%, you have nearly 1.5x your invested capital in real growth.
India's historical inflation has averaged around 6% annually. Even an 8% equity CAGR beats inflation meaningfully over a decade. The bigger risk is not the difference between 8% and 12% returns — it is stopping the SIP mid-way. An investor who runs a SIP for 5 years and exits during a correction will almost always underperform an investor who stays invested for 10 years at even lower returns.
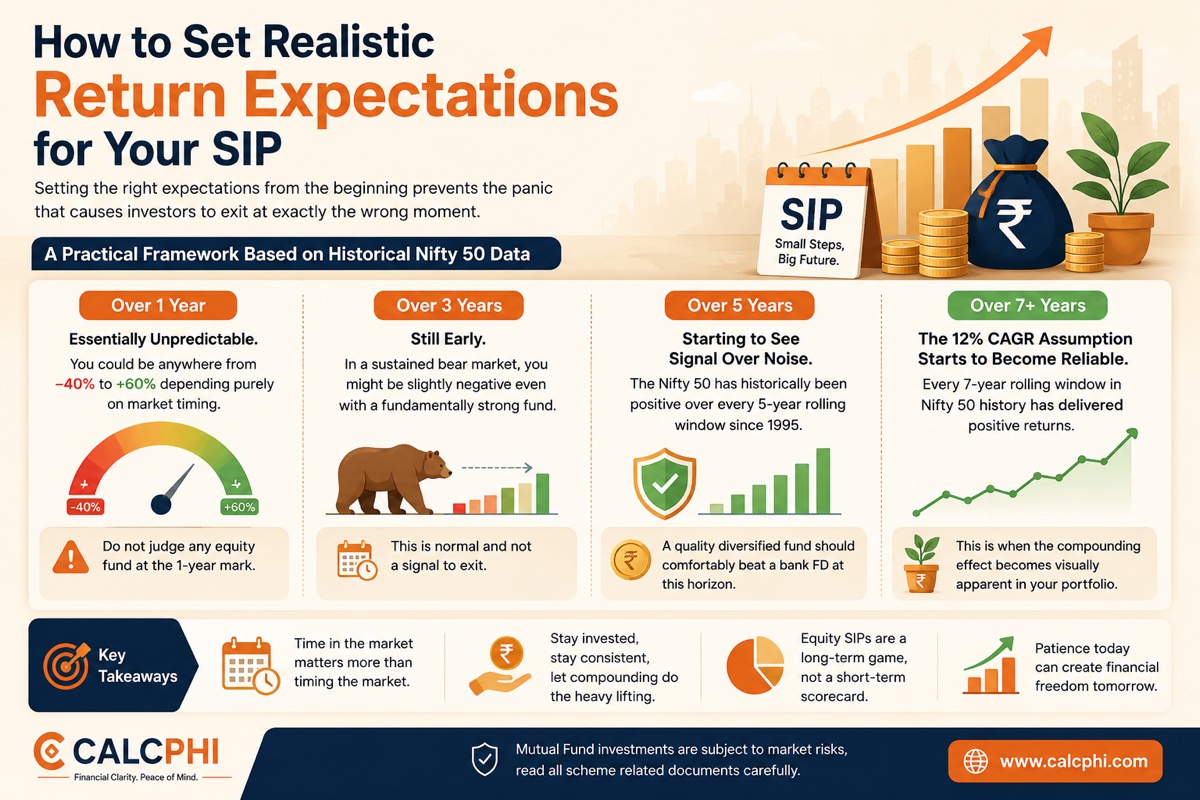
How to Set Realistic Return Expectations for Your SIP
Setting the right expectations from the beginning prevents the panic that causes investors to exit at exactly the wrong moment. Here is a practical framework based on historical Nifty 50 data:
- Over 1 year: Essentially unpredictable. You could be anywhere from −40% to +60% depending purely on market timing. Do not judge any equity fund at the 1-year mark.
- Over 3 years: Still early. In a sustained bear market, you might be slightly negative even with a fundamentally strong fund. This is normal and not a signal to exit.
- Over 5 years: Starting to see signal over noise. The Nifty 50 has historically been positive over every 5-year rolling window since 1995. A quality diversified fund should comfortably beat a bank FD at this horizon.
- Over 7+ years: The 12% CAGR assumption starts to become reliable. Every 7-year rolling window in Nifty 50 history has delivered positive returns. This is when the compounding effect becomes visually apparent in your portfolio.
The Power of Step-Up: What Happens When You Increase Your SIP Annually
One underused strategy that dramatically improves outcomes is the Step-Up SIP — increasing your monthly SIP by a fixed percentage every year. If you start at ₹10,000 per month and increase by 10% annually, your SIP grows to ₹10,000 in Year 1, ₹11,000 in Year 2, ₹12,100 in Year 3, and so on.
Over a 20-year period at 12% CAGR, a flat ₹10,000/month SIP accumulates approximately ₹98 lakh. The same SIP with a 10% annual step-up accumulates approximately ₹1.64 crore — nearly 67% more wealth. The extra amount comes not just from investing more, but from the compounding advantage of the additional investments having longer time horizons.
Tax on SIP Returns: What You Actually Take Home
A 12% CAGR sounds excellent. But equity mutual fund gains are taxable, and the effective post-tax return depends on your holding period.
For equity mutual funds, gains held for more than 12 months are classified as Long-Term Capital Gains (LTCG). Under current rules for AY 2026-27, LTCG on equity above ₹1.25 lakh per financial year is taxed at 12.5% without indexation. Short-Term Capital Gains (STCG) — on units held for less than 12 months — are taxed at 20%.
Since SIPs involve multiple purchases on different dates, each instalment has its own acquisition date and holding period. This means partial withdrawals can trigger STCG on recent instalments even if the overall SIP is old. After tax, a 12% pre-tax CAGR on a long-term equity SIP typically translates to a post-tax return in the range of 10.5–11%, depending on your corpus size and redemption amount in a given year.
Model your SIP's projected growth at 12% and other return scenarios:
SIP Calculator →Frequently Asked Questions
-
Is 12% CAGR a realistic expectation for an equity SIP in India?
Over long holding periods of 10 years or more, 12% CAGR is a historically reasonable assumption for diversified large-cap or flexi-cap equity funds benchmarked to the Nifty 50 or Nifty 500. The Nifty 50 has delivered approximately 11–13% CAGR over rolling 10-year periods since 1995. Individual fund performance varies, and past returns do not guarantee future outcomes, but 12% is a widely accepted planning benchmark.
-
Why does my SIP not show 1% monthly growth if the annual return is 12%?
Because 12% annual CAGR does not equal 1% per month. The mathematically correct monthly equivalent of 12% annual compounding is approximately 0.949% per month. Additionally, market returns are never smooth — monthly NAV movements can range from −10% to +8% in a single month, even in a fund that delivers 12% CAGR over the long term.
-
Should I stop my SIP when the market falls sharply?
No. Market corrections are when SIPs work best. When NAV falls, each monthly instalment buys more units at a lower price — rupee cost averaging at its most effective. Stopping a SIP during a crash locks in losses and means you miss the recovery rally, which is usually the period of strongest returns. If anything, lumpsum top-ups during market corrections can significantly boost long-term returns.
-
What is XIRR and why does it matter more than CAGR for SIPs?
XIRR (Extended Internal Rate of Return) accounts for the timing of each cash flow — each monthly instalment in a SIP happens on a different date. CAGR assumes a single investment at a single point. For SIPs with multiple investments over time, XIRR gives you the true annualised return on your actual cash invested. Always use XIRR when comparing SIP performance, not the fund's advertised CAGR.
-
How much will ₹5,000 per month grow to in 15 years at 12% CAGR?
A ₹5,000/month SIP for 15 years at 12% CAGR grows to approximately ₹25 lakh. Total amount invested is ₹9 lakh. The additional ₹16 lakh is purely from compounding growth. You can verify this and model different scenarios using CalcPhi's SIP Calculator.
-
Does inflation affect my SIP returns?
Yes, and this is an often-overlooked consideration. If inflation averages 6% annually and your SIP earns 12% CAGR, your real (inflation-adjusted) return is approximately 5.7% per year. This still represents meaningful wealth creation, but it is lower than the headline 12% figure. Always factor inflation into long-term SIP planning.
Disclaimer: All figures in this article are for educational and illustrative purposes only. Past market returns are not a guarantee of future performance. Mutual fund investments are subject to market risks. Nothing in this article constitutes financial advice. Please consult a SEBI-registered financial advisor for personalised investment guidance.