CAGR vs XIRR: Which Return Metric Should You Use for Mutual Funds?

You just checked your mutual fund statement and found two different return numbers sitting right next to each other — one labelled CAGR and another labelled XIRR. They are both measuring the same investment over the same period, yet they show different figures. Which one should you trust? More importantly, which one actually tells you how your money performed?
This is one of the most common points of confusion for Indian investors, and it matters far more than most people realise. Using the wrong metric to evaluate a fund can make a poor investment look great — or cause you to exit a well-performing fund too early. This article breaks down both metrics in plain language, explains exactly when to use each one, and shows you how to calculate them without a finance degree.
What Is CAGR and How Does It Work?
CAGR stands for Compound Annual Growth Rate. It measures how much an investment has grown on an annualised basis, assuming the growth happened at a perfectly steady rate each year.
The formula is straightforward: take the final value of your investment, divide it by the initial amount you put in, raise it to the power of 1 divided by the number of years, and subtract 1. That gives you the annualised growth rate.
For example, if you invested ₹1,00,000 in a lumpsum and it grew to ₹2,00,000 in 6 years, the CAGR would be approximately 12.25% per annum. This means that if your investment had grown at exactly 12.25% each year without a single deviation, you would have arrived at the same final amount. You can use CalcPhi's free CAGR Calculator to calculate the annualised return on any one-time investment instantly — no spreadsheet required.
CAGR is particularly useful when you want to compare two lumpsum investments made at the same point in time, or when you want to benchmark how a fund has performed over a fixed period. It is clean, easy to understand, and straightforward to compute.
Where CAGR Falls Short
CAGR has one significant blind spot: it assumes a single investment made at one point in time. The moment you start adding or withdrawing money at irregular intervals — which is exactly what most investors do through SIPs, top-ups, or partial redemptions — CAGR stops being an accurate picture of your actual returns.
Think about it this way. If you invest ₹10,000 each month through a SIP, every monthly instalment is invested at a different NAV and has been in the market for a different length of time. The first instalment has been working for 10 years while the last instalment has been working for only one month. Calculating a single CAGR across all of this as if it were one lumpsum would be mathematically incorrect and misleading.
What Is XIRR and Why Does It Exist?
XIRR stands for Extended Internal Rate of Return. It is designed specifically to handle investments and withdrawals that happen at irregular intervals over time.
Where CAGR assumes a single cash flow, XIRR accounts for every single cash flow — every SIP instalment, every additional top-up, every dividend reinvestment, and every partial withdrawal — and calculates the annualised rate of return that ties all of those movements together. It does this by finding the rate at which the net present value of all cash flows equals zero.
In practical terms, XIRR answers the question: "If I account for every rupee that went in, on every date it went in, and compare it to the final value today — what is my true annual return?" Most mutual fund apps and CAMS/Karvy statements in India show XIRR as the default return metric for SIP portfolios, and there is a very good reason for that. It is simply the more honest number when multiple transactions are involved.
CAGR vs XIRR: The Core Difference
The fundamental difference comes down to cash flow complexity. CAGR is built for a single investment at a single point in time. XIRR is built for real-world investing, where money moves in and out at different dates throughout the investment period.
Suppose you started a monthly SIP of ₹5,000 in January 2020. Over five years you made 60 instalments, and in January 2025 your total portfolio value is ₹4,85,000. Your total investment was ₹3,00,000 and your profit was ₹1,85,000.
If you used a simple CAGR by plugging in ₹3,00,000 as the starting value and ₹4,85,000 as the ending value over 5 years, you would get a return of approximately 10.1%. But this is misleading, because not all ₹3,00,000 was in the market for 5 years. Most of it was invested much later and had far less time to grow.
XIRR corrects for this by treating each ₹5,000 instalment as a separate cash flow with its own date. The result is a noticeably different — and more accurate — annualised return figure that reflects the actual time each rupee spent in the market. To see exactly how your own SIP is performing, try CalcPhi's SIP Calculator. It shows your total invested amount, expected maturity value, and estimated returns in seconds.
When Should You Use CAGR?
Use CAGR when you are evaluating a mutual fund's historical performance as reported by the fund house. When a fund says it has delivered 15% returns over 10 years, it is using CAGR based on the fund's NAV movement. This is a fair way to compare two funds because it normalises performance to an annualised rate on a like-for-like basis.
Use CAGR when you made a single lumpsum investment and have not added to or withdrawn from it since. In this case, your entire investment entered the market at one point, and CAGR gives you a clean picture of how that money grew. CalcPhi's Lumpsum Calculator uses this principle to project the growth of a one-time investment over any time horizon.
Use CAGR when comparing the performance of different asset classes — for instance, equities vs gold vs fixed deposits — over the same historical period. Since you are comparing the growth of a notional single investment in each asset, CAGR is the appropriate tool.
When Should You Use XIRR?
Use XIRR whenever your investment involves multiple cash flows at different points in time.
If you invest through a monthly SIP, XIRR is the only metric that accurately measures your personal rate of return. Every instalment entered the market on a different date and has been compounding for a different duration. XIRR accounts for all of this.
If you have made ad hoc top-ups to your mutual fund over the years — say, an extra ₹50,000 during a market dip in October 2022 and another ₹30,000 in March 2023 — CAGR cannot account for these. XIRR can.
If you have made partial redemptions, XIRR can incorporate those outflows as well, giving you a true picture of what your money earned net of withdrawals.
For anyone doing a Step-Up SIP — where you increase your SIP amount by a fixed percentage each year — XIRR is essential because each year's instalments are at different amounts. CalcPhi's Step-Up SIP Calculator helps you visualise the compounding power of annual SIP increases, and your actual return on such a plan would only be accurately captured by XIRR.
A Practical Example: Why the Numbers Diverge
Anjali started a SIP of ₹10,000 per month in January 2021. She increased it to ₹15,000 per month in January 2023. In December 2024, her portfolio was worth ₹6,20,000. Her total investment over these four years was approximately ₹4,80,000.
If she naively calculated CAGR using ₹4,80,000 as the base and ₹6,20,000 as the end value over 4 years, she would get a CAGR of around 6.6%. This looks unimpressive and might make her question whether her fund is underperforming.
But XIRR tells a different story. The early instalments — the ₹10,000 she put in from January 2021 — have been invested for nearly 4 years and have had significantly more time to compound. When XIRR accounts for the timing of every single cash flow, the actual annualised return might be closer to 11–12%, which is a healthy outcome for an equity fund.
This is precisely why SEBI and most mutual fund platforms in India default to XIRR for SIP performance reporting. CAGR would systematically understate or misstate returns for periodic investors. Want to see how your own lumpsum investments are growing? Head over to CalcPhi's MF Returns Calculator to calculate the absolute return and CAGR from your NAV data.
How Are CAGR and XIRR Calculated?
You do not need to calculate either of these manually. But understanding the mechanics helps you interpret them better.
CAGR uses a simple formula: [(Final Value / Initial Value) ^ (1/Number of Years)] − 1. It requires only three inputs and gives one clean annualised number.
XIRR, on the other hand, is an iterative calculation. It uses each cash flow and its corresponding date to find the discount rate at which all cash flows — positive and negative — sum to zero in present value terms. This is why spreadsheet tools like Microsoft Excel and Google Sheets have a dedicated XIRR function that requires a column of amounts and a corresponding column of dates.
Most mutual fund platforms in India compute XIRR automatically in the background. If you are pulling data from CAMS or Karvy, the consolidated account statement will typically show XIRR as the overall portfolio return.
Common Mistakes Investors Make With These Metrics
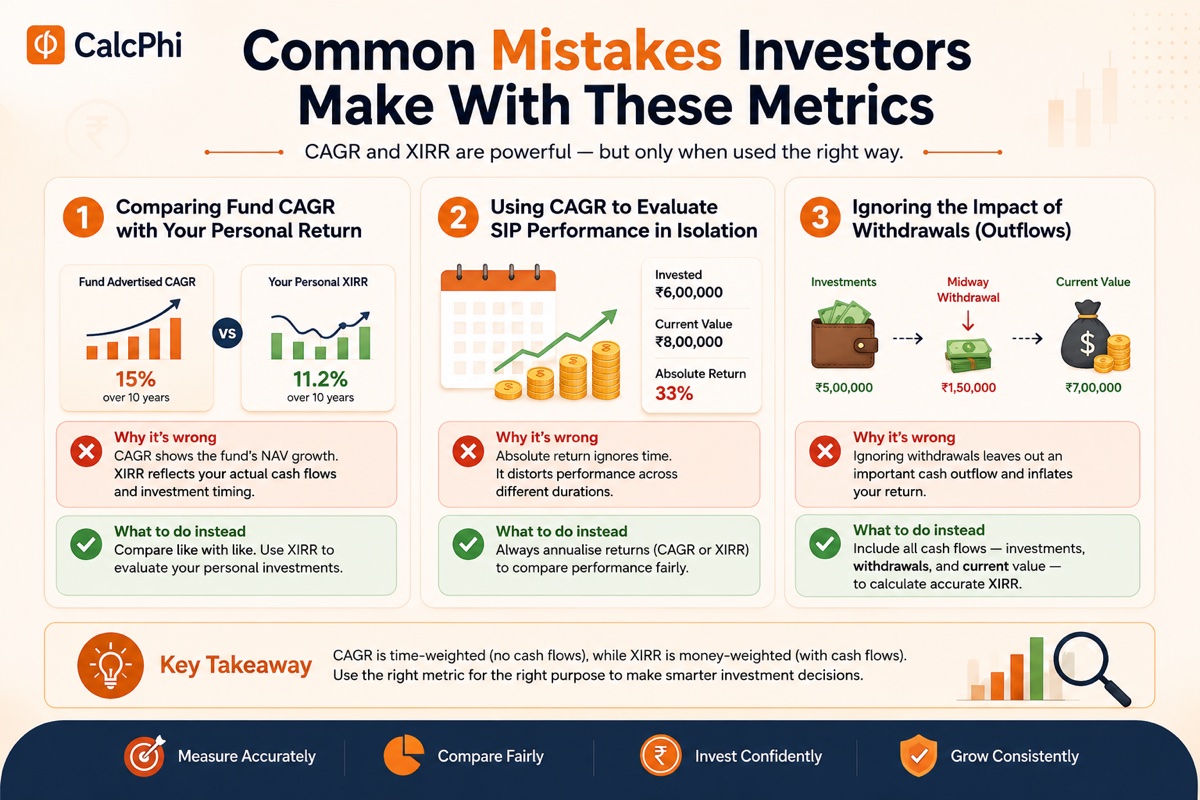
One of the most frequent mistakes is comparing a fund's advertised CAGR (which reflects the fund's NAV growth) with your personal portfolio return, which is based on actual cash flows. These are two completely different things. A fund can have a 15% CAGR over 10 years, but your personal XIRR on the same fund could be lower if you invested heavily right before a correction, or higher if you happened to time some purchases well.
Another mistake is using CAGR to evaluate SIP performance in isolation. Many investors look at a simple absolute return — "I put in ₹6 lakhs and I have ₹8 lakhs, so I made 33%" — without annualising it, which makes short-duration investments look worse and long-duration investments look better than they are. Always annualise.
A third mistake is ignoring the impact of withdrawals on overall return calculations. If you redeemed a portion of your portfolio midway, that outflow must be included in the XIRR calculation. Leaving it out inflates your apparent return figure.
CAGR vs XIRR: Quick Reference Summary
| Situation | Use | Why |
|---|---|---|
| Lumpsum investment, no subsequent transactions | CAGR | Single cash flow — CAGR is accurate and simple |
| Monthly SIP with any number of instalments | XIRR | Each instalment has its own investment date |
| Comparing two funds' published performance | CAGR | NAV-based, like-for-like comparison |
| Portfolio with top-ups or partial redemptions | XIRR | Only metric that handles irregular cash flows correctly |
| Step-Up SIP with increasing annual amounts | XIRR | Different amounts invested at different times |
| Benchmarking your return vs FD or PPF | XIRR vs compound rate | XIRR is your actual earned return — apples to apples |
Frequently Asked Questions
Is XIRR always higher than CAGR for a SIP?
Not necessarily. XIRR can be higher or lower than a naive CAGR estimate, depending on the timing of cash flows and the pattern of market returns during the investment period. In rising markets, XIRR often appears lower than the fund's own CAGR because later instalments — which have had less time to grow — form a larger share of your investment. In markets that rose sharply in the early years, XIRR can appear higher.
Can I calculate XIRR without Excel or a finance app?
Yes. You can calculate XIRR in Google Sheets using the =XIRR(values, dates) function for free. Most mutual fund platforms in India, including MF Central, Zerodha Coin, and Groww, also compute XIRR automatically for your portfolio and display it in the dashboard.
Which metric should I use to compare two mutual funds?
Use CAGR to compare two funds based on their published historical performance, since both funds report returns based on NAV growth. Use XIRR only to compare your personal experience with each fund, factoring in your actual investment dates and amounts.
Why does my SIP return in the app look different from the fund's stated returns?
The fund's stated return is based on NAV CAGR — how much ₹1 grew to over a specific period. Your app shows XIRR, which reflects how your actual investments grew given the specific dates and amounts you invested. These will almost always differ and both figures are correct for their respective purposes.
Is XIRR relevant for fixed deposits and PPF?
For regular FDs and PPF contributions, most platforms calculate returns using standard compound interest formulas. However, if you have made irregular PPF contributions over the years, XIRR can still give you a useful picture of your personalised annualised return. CalcPhi's PPF Calculator models PPF growth using standard compounding rules.
What is a good XIRR for an equity mutual fund SIP?
For a large-cap equity fund, a long-term XIRR of 10–13% is generally considered solid, broadly in line with Nifty 50 historical returns. Mid-cap and small-cap funds may deliver 13–18% XIRR over long periods, but with higher volatility. Anything above 18% sustained over 10+ years would be exceptional. Always benchmark against the fund's category average rather than an absolute number.
Disclaimer: The information in this article is for educational and estimation purposes only. All financial figures, examples, and return benchmarks are illustrative and do not constitute investment advice or a guarantee of returns. Mutual fund investments are subject to market risk. Please read all scheme-related documents carefully and consult a SEBI-registered financial advisor before making any investment decisions.